Thursday, April 11, 2013

Silver update

It has been a while since I posted any metals analysis in this blog but, given recent developments, I believe an update is in order.

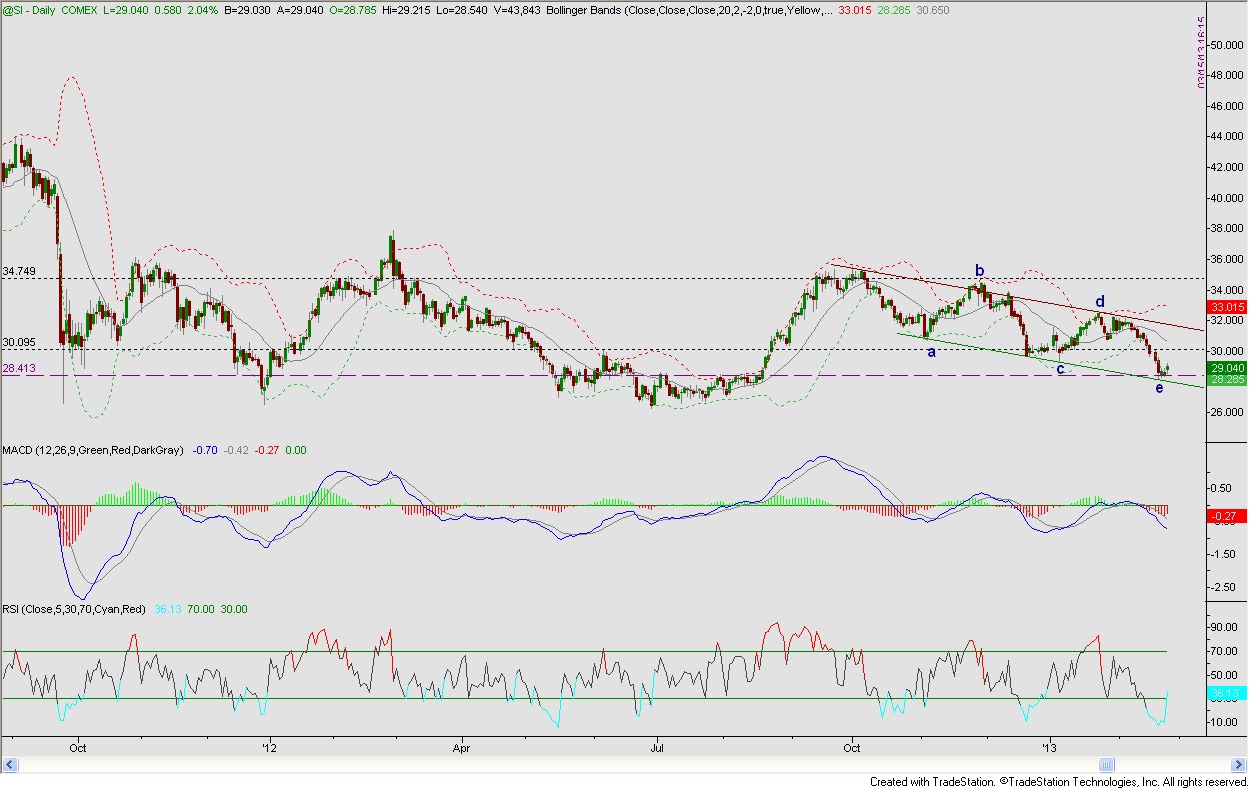
From December to February, I had posited that silver was likely bottoming with a final diagonal (a-b-c-d-e) and would likely stabilize above $26.10 and begin its explosive FINAL Wave 5 rally thereafter. Given recent developments, however, I believe that I may have been premature in calling for a final low at $26.10... and I am now expecting that silver will experience one more new low (around $22?) in the coming months, before Wave 5 commences.

My reasons for this altered prediction are two-fold:

1) The wave count for silver now appears to preclude a final diagonal and is more likely Wave (A) of a Wave Y double zig-zag (see chart below). The 7 waves down from the $35.44 high indicate that Wave (A) completed at (e) and that we are now in an expanded flat that should rally back up around $30 before Wave (C) of the double zig-zag continues downward to fresh lows.


 and...

2) The wave count for Silver Wheaton indicates that the recent decline from $41.04 is in 5 waves, which indicates the completion of Wave (A) in a Wave Y double zig-zag. I now expect SLW to rally sharply upwards to the $32.50-$33 level in a Wave (B) rally and then to decline to a final Wave (C) level below the 2012 low of $22.64.


Monday, February 25, 2013

Gold & Silver update: key Wave 4 bottoms formed??

Based on the technical readings below, I believe that both gold and silver have put in their key Wave 4 lows and that an explosive Wave 5 is underway. Granted, this move may take 6-12 months to fully transpire but it is a significant development and a unique opportunity to profit from an explosive move.

GOLD


SILVER


Monday, January 28, 2013

1/28: GLD & SLV update

It has been a few weeks since my last update and I would like to review the technicals on gold and silver. As you can see below, we have not quite reached trendline resistance on gold & silver just yet (marked as Wave D on both charts) but I still believe we are likely to make an attack on those levels before we make a final low set in (marked Wave e on both charts).


Friday, January 11, 2013

1/11: GLD & SLV update

Gold (GLD) and Silver (SLV) update:

There has been a concerted attack on the precious metals this morning but I strongly suspect that the metals are bottoming here and will soon reverse higher. My targets for both metals is a Wave D high near their trendline resistance...


1/11: SLW update

SLW update:

Silver Wheaton has been consolidating just below the short-term resistance trendline this morning and I believe this is a good sign that energy is re-building for the next burst up towards the Wave c/X level around the $40.


Thursday, January 10, 2013

1/10: SLW rallying & at critical resistance/breakout level

SLW update:

Silver Wheaton is at critical trendline resistance and is showing very positive strength.

I believe the stock will need to consolidate for the rest of the day before it can muster up the energy to break through this resistance trendline, however, once this trendline is breached/captured I think SLW will thrust towards the red resistance trendline very quickly (next week).

Gold and silver, too, are showing positive technical indications of a continued short-term rally, however, it is very important to remember that this rally in SLW - and the precious metals complex in general - is in the context of a continuing corrective pattern and that there should be one more additional sell-off in February that will present a wonderful buying opportunity for a powerful metals rally for the remainder of 2013.


Tuesday, January 8, 2013

1/8: GDX update - ready to launch?

GDX (Gold Miners ETF) has built an extended and powerful RAMP/trendline to launch from...

This appears to confirm that a sharp short-term rally in the precious metals is imminent.


1/8: SLW update - poised to rally now?


SLW update:

I believe there is still good reason to project that SLW makes it up to $40 in the next few weeks.

Because Wave a was $3.55 ($37.58-$34.03), then if Wave c is 1.618*3.55, we could see a $5.74 rally up to $40.

Calculations:
Wave a: 3.55
IF Wave c = 1.618 x 3.55= $5.74, then...
$34.25+$5.74 = $40.00?


1/8: Silver update

As I have been saying for several weeks now, I believe we are in the final phase of silver's extended Wave (4) consolidation that began when silver peaked near $50 in early 2011. From an Elliott Wave perspective, I believe we have a Wave W low at $26.10 earlier this summer... a Wave X high at $35.44... and one more low coming perhaps near $28 in the coming month or two. This final Wave Y appears to be a characteristic ending diagonal, and that is why I expect one more new Wave (e) low after a Wave (d) up in the next few weeks.


Silver WEEKLY


Silver DAILY


Friday, January 4, 2013

1/4: GDX - Gold Miners ETF

Once again, the Gold Miners ETF has held the high $44 level and is rallying above $45... indicating that a short-term bottom has been set in the gold/precious metals complex.

My upward target for the GDX is around $51, but I still believe there is one more selloff in the metals sector after this rally peaks in the coming week(s).


1/4: SLW update: ElliottWave count adjustment


SLW update:

Considering the recent weakness, I believe we need to adjust the Elliott Wave count and move the Y wave from the $34.71 low to the $34.03 low. The rally from $34.03 has been clearly in 3 waves so it is not impulsive, confirming that any new high above $37.58 is still corrective and that eventually we should see a new low below $34.03. I still expect a new high near $40+ in the coming weeks.


Thursday, January 3, 2013

1/3: Silver update - no Wave (4) bottom just yet

Good morning,

I have posted Daily and Weekly charts of Silver below to give a picture of where I think we are in the Wave (4) consolidation.

First, we look at the Weekly chart of Silver.

This chart shows us several indications of a soon-to-come Wave (4) low:

1) the Silver price is clearly testing both the green downtrending and uptrending support lines drawn...
2) RSI and MACD have been uptrending and confirming over the past year; and
3) a solid base at $26 has already been set with 3 successive lows.

I am still expecting a upward test of the median Bollinger Band around $32.50-$33 in a Wave (d) before we get a final low in a Wave (e)/Y around $28, perhaps in mid to late February.


For a closer look, we now analyze the Daily chart of Silver:

Again, we see how Silver has stabilized three (3) times at the $26 level and has crossed over the downtrending support line only to come down and attempt to re-test the line (coming up slightly short of doing so on the Wave (a) and Wave (c) recent selloffs). If Silver does test the trendline in February, it appears the low would come around $28.

If we do hold support around $28 and start to rally, then I expect that Silver will thereafter embark on an final, explosive Wave (5) of V impulse move to new highs above $50!


Wednesday, January 2, 2013

1/2: S&P 500 update: Budget Agreement rally soon to fizzle?

As expected, the Budget Agreement passed by the U.S. House and Senate (a short-term patch job to a long-term structural dilemma) has caused a short-covering rally and the S&P 500 index is now at relatively strong short-term resistance, indicated by the following:

  • the index is at the upper Bollinger Band level, where it has consistently met with short-term resistance over the past few years; and
  • both RSI and MACD are diverging.

Although we may linger near the highs for the next few days, possibly into next week, I think another selloff is coming in mid to late February before we see further highs. I do expect new all-time highs in the broad markets this year but only marginally so. The intermediate technical picture for the broad markets, however, is that a new crisis low should occur (lower than the 2009 low) sometime in 2016 or so, based on the Elliott Wave expanding diagonal shown in the monthly chart at the bottom.


Daily Chart


Monthly Chart


1/2: SLW update - Wave x rally in progress


SLW update:

With the U.S. House of Representative and the U.S. Senate passing a Budget Agreement (only a short-term fix to the structural deficit issue), we are finally getting the jolt of impulsive energy that I've been expecting in the metals complex and Silver Wheaton has displayed very strong buying power in the past 2 days of trading.

Notice that we've now recaptured the moving average on the daily Bollinger Bands (very bullish) and we are now battling to capture the $37.30 short-term resistance level. It appears to me that SLW wants to test the upper Bollinger band level around $38 and I believe that we will see short-term resistance once we get there, possibly falling back to test the $37.30 level again.

In general, I am still expecting SLW to make it all the way to the red rising resistance trendline in the coming weeks (near $40/Wave x)... then fail to capture it... and ultimately collapse to one final Wave (II) low near the support clusters around $32.